
Credentials Matter
In 2019, ExcelinEd and Burning Glass Technologies (now Lightcast) conducted a first-of-its-kind research project that identified national trends and shared state-level information about the industry credentials students earn and the credentials employers demand.
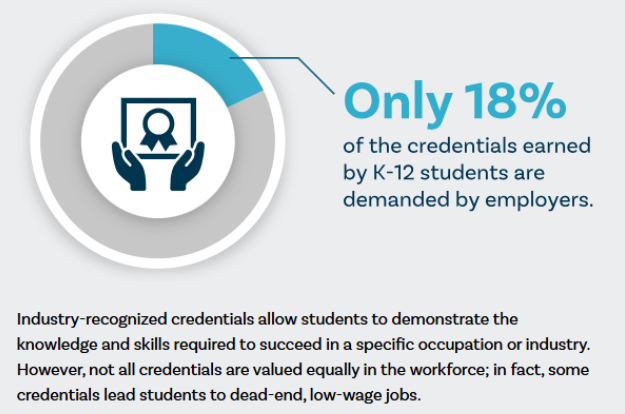
ExcelinEd found that not all credentials are created equal. And this is a challenge that persists throughout states.
The full Credentials Matter site has been sunset due to outdated data, but there are continued opportunities for states across K-12 and postsecondary. States can (1) strengthen data collection, (2) examine what credentials are promoted on their lists, and (3) increase the value of credentials that students earn.
More recently, ExcelinEd conducted in-depth research in Tennessee and Ohio that showed similar trends to the initial research. In Tennessee, 10% of the promoted credentials across K-12 and postsecondary register employer demand. And in Ohio, only 22% of promoted credentials for K-12 show demand from employers.
For additional information on how to strengthen pathways for learners, go to PathwaysMatter.org.
The full reports with state-specific data can be found here.
Credentials Matter Research
Credentials Matter Phase 2: A 2020 Update on Credential Attainment and Workforce Demand in America builds on the groundbreaking, first-of-its-kind research that was released in A National Landscape (2019, below). The updated report expanded the research scope from Phase 1 in three capacities: 1) Increased the number of states that participated by sharing K-12 credential attainment data; 2) Included postsecondary credential attainment data for 4 states; and 3) Conducted a qualitative survey that shows how states support credential attainment in both K-12 and postsecondary institutions.
Credentials Matter: A National Landscape (2019) explores the state of credential data collection and alignment with workforce demands across all 50 states. This report offers recommendations for state policymakers, industry credentialing entities, educators and employers to work together to ensure all students have access to credentials that lead to high-skill, high-wage, in-demand careers in their state.
Where Credentials Meet the Market (2019) examines the impact of credential attainment on long-term student outcomes. This second report analyzes the credentials students earn in high school and their impact on students’ secondary completion, postsecondary enrollment and completion as well as wage earnings. It provides insights into the return on investment of earning a credential in Florida, Indiana and Kentucky—three states that collect rich, student-level data that includes credential attainment.